Why Data Scientists Should Join Toastmasters

Public speaking used to be a big sore spot for me. I was able to do it, but I truly hated it and it caused me a great deal of grief. When I knew I had to speak it would basically ruin the chunk of time from when I knew I would have to speak to when I did it. And don’t get me started on impromptu speaking – whenever something like that would pop up, I would feel pure terror.

Things got a bit better once I entered the working world and had to speak somewhat regularly, giving presentations to clients and staff and participating in meetings. But still, I hated it. I thought I was no good and had a lot of anxiety associated with it.

A little over a year ago, I finally had enough and decided I needed to do something about it. I joined the Venio Dictum toastmasters group in Winnipeg. After only a few months, I started to become much more relaxed and at ease when speaking. Today, one year later, I actually look forward to giving speeches and facing the challenge of impromptu speaking. A year ago, if you told me I would feel this way now, I wouldn’t have believed you.

Imagine being the type of person that volunteers to address a crowd or give a toast off the cuff. Imagine looking forward to speaking at a wedding, meeting, or other event. Imagine being totally comfortable in one of those “networking event” situations where you enter a room crowded full of people you don’t know. A year ago, I used to think people that enjoyed this stuff were from another planet. Now, I understand this attitude and I feel like I’m getting there myself.

Why should a Data Scientist care about speaking skills?

  • Communication is a critical part of the job

Yes, a huge part of being a data scientist is having skills in mathematics, statistics, machine learning, programming, and having domain expertise.

However, technical skills are not anywhere close to the entire picture. You might be fantastic at data analysis, but if you aren’t able to communicate your results to others, your work is basically useless. You’ll wind up producing great analysis that ultimately never get implemented or even considered at all because you failed to properly explain its value to anyone.

Speaking is a huge part of communication, so you need to be good at it (the other big area of communication is writing, but that’s a topic for another day).

  • Professional advancement

To get to the next level in your career (and to get a data scientist job in the first place), it really helps to be a confident and persuasive speaker.

Job interviews are a great example. When you apply for a job, there will always be an interview component where you’ll have to speak and answer questions you have not prepared for in advance. Even if your resume and portfolio look great, it’s going to be hard for an employer to hire you if you bomb the interview.

This also applies to promotions from within your current company. Advanced positions typically require rely more on communication and management skills like speaking and less on specific technical skills.

  • Network / connection building

Improved speaking doesn’t just make your presentations better: it makes your day-to-day communications with colleagues and acquaintances better too. You’ll become a better conversationalist and a better listener.

As a data scientist, you’ll likely be working with multiple teams within your organization and outside your organization. You will need to gain their trust and support, and better speaking helps you do that.

  • It makes you a better thinker / learner

The motto of my toastmasters club is “better listening, thinking, and speaking” because a huge part of speaking is learning how to organize your thoughts in a clear package so they are ready for delivery to your audience. As George Horace Latimer said in his book Letters from a Self Made Man to his Merchant Son:

“There’s a vast difference between having a carload of miscellaneous facts sloshing around loose in your head and getting all mixed up in transit, and carrying the same assortment properly boxed and crated for convenient handling and immediate delivery.”

Having a lot of disparate facts in your head is not very useful if they are not organized in a way that lets you easily access them when the time is right. Preparing a speech forces you to organize your thoughts, create a coherent narrative, and understand the principles underlying the ideas that you’re trying to communicate.

This habit of understanding the underlying rules and principles behind what you learn is referred to by psychologists as “structure building” or “rule learning”. As described in the book Make it Stick, people who do this as a habit are more successful learners than people that take everything they learn at face value, never extracting principles that can be applied to new situations. Public speaking cultivates this skill.

This is particularly important for data scientists, given the incredibly diverse range of subjects we are required to develop expertise in and the constantly evolving nature of our field. To manage this firehose of information, we must have efficient learning habits.

One great thing about Toastmasters is you can give a speech on any topic you want. So go ahead, give a speech on deep reinforcement learning to help solidify your understanding of the topic (but explain in a way that your grandmother could understand).

  • Speaking is a fundamental skill that will impact your life in many other ways

Speaking is a great example of a highly transferable skill that pays off no matter what you decide to do. Since it deeply pervades everything we do in our personal and professional lives, the ROI for improving is tremendous. (In my opinion, some other skills that fall into this category include writing, sales, and negotiation.)

Consider all the non-professional situations in your life where you speak to others (e.g. your spouse, kids, parents, family, acquaintances, community groups). Toastmasters will make all of these interactions more fruitful.

Suppose you decide data science isn’t right for you. Well, you can be close to 100% sure the speaking skills you develop through Toastmasters will still be valuable whatever you decide to do instead.

In terms of the 80-20 rule, working on your public speaking is definitely part of the 20% that yields 80% of the results. It’s worth your time.

How Does Toastmasters Work?

Although each club may do things a little differently, all use the same fundamental building blocks to make you a better speaker:

  • Roles: At each meeting, there are a list of possible “roles” that you can play. Each of these roles trains you in a different public speaking skill. For example, the “grammarian” observes everyones language and eloquence, “gruntmaster” monitors all the “ums”, “uhs”, “likes”, “you knows” etc. There is a “Table Topics Master” role where you propose random questions to members they have not prepared for in advance and they have to do an impromptu speech about it for two minutes (an incredibly valuable training exercise, especially if you fear impromptu speaking). Here are the complete list of roles and descriptions of the roles in my club.
  • Prepared speeches: Of course, there are also tons of opportunities to provide prepared speeches. Toastmasters provides you with manuals listing various speeches to prepare that give you practice in different aspects of public speaking. You do these speeches at your own pace.
  • Evaluations: Possibly the most valuable feature of Toastmasters is that everyone’s performance is evaluated by others. In a Toastmasters group, you’ll often have a subset of members that are very skilled and experienced speakers (my club has several members that have been with the club 25+ years), and the feedback you get can be invaluable. It’s crucial for improvement, and it’s something you don’t usually get when speaking in your day-to-day life.

Go out and find a local Toastmasters group and at check it out as a guest to see how it works up close. They will be more than happy to have you. You owe it to yourself to at least give it a try. If your experience is anything like mine, you’ll be kicking yourself for not starting earlier (and by “earlier” I mean high school or even sooner – it’s definitely something I’m going to encourage my daughter to do).

Let’s Scrape a Blog! (Part 1)

One thing I’ve been considering lately is what kind of intelligence you could gain from scraping a blog and analyzing the data. To test this out, this is the first in a series of posts where I’ll scrape a blog and try to squeeze out every last bit of useful or interesting intelligence I possibly can.

I’ll start off simple, but down the road I plan to use more advanced techniques in machine learning and natural language processing techniques to see what additional information these tools can uncover. I’m keeping all my analysis on a Jupyter notebook you can find on Github here.

The target site I’ll be using for my analysis is my all-time favourite blog: Marginal Revolution. I have been following this blog pretty much daily since 2005 when I started my undergraduate degree. It’s run by the economists Tyler Cowen and Alex Tabarrok, who are personal heroes of mine.

Why scrape a blog?

For me, scraping Marginal Revolution was just something I did for kicks. Since I’m so interested in the content of the blog, I want to be able to do very customized searches of blog posts that would not be possible through the blog’s built-in search feature.

But there are reasons other than “just for fun” that you might want to scrape a blog. For example, maybe the blog is a competitor or in an industry you’re researching. Maybe you want to find out:

  • Roughly how many people read / comment on the blog
  • Blogging strategy in terms of number, type, and timing of posts
  • Which types of posts produce the most discussion / comments / controversy
  • What notable people read the blog (i.e. seeing if they comment in the comments section)
  • Analyzing trends over time to determine if things have changed

…and I’m sure there are more possibilities.

Very brief overview of how the scraper works

My goal with the scraper was to get each individual post from the Marginal Revolution website. Marginal Revolution was fairly easy to scrape since the list of posts by month provided a predictable URL structure that made it possible to gather the links for each individual post across the entire website. With the full list of links, it was then simply a matter of making a request to each of these URLs and saving the resulting blog post HTML to disk. The scraper ultimately gathered 23,342 posts.

The final step was to extract the information of relevance through each HTML file and conduct data cleaning. I did this with the python BeautifulSoup library to parse the html and then pandas to do some further data cleaning and feature generation. The final result was a nice csv file:

My scraper had a generous delay between requests so I didn’t create a burden on the website. As you would expect, the scraper took a very long time to run to get all the posts – I ran it slowly over a period of about 3 weeks.

Initial Analysis

Often times when reading Marginal Revolution, I would want to search in ways that the built-in search feature wouldn’t allow. For example, I know that Marginal Revolution has had a few guest posts over the years, but they are difficult to find with the search feature because of the sheer volume of posts. Also, many people guest posting are often mentioned in the regular daily posts by Tyler and Alex, further complicating the search.

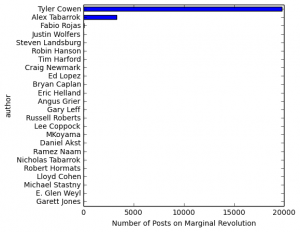
With all the posts scraped, figuring out who has all posted on the site and how many posts they’ve done was easy:

Obviously it’s totally dominated by Tyler Cowen and Alex Tabarrok, as any reader of the blog would expect, but the plot reveals some interesting authors that I had no idea posted on Marginal Revolution.

Now, say I want to look at all the posts by Tim Harford. It’s just a simple filter operation to get all the links and check them out (15 of them):

http://marginalrevolution.com/marginalrevolution/2005/07/dear_economist_-2.html
http://marginalrevolution.com/marginalrevolution/2005/07/using_cartoons_.html
http://marginalrevolution.com/marginalrevolution/2005/07/marginal_revolu-2.html
http://marginalrevolution.com/marginalrevolution/2005/07/we_shall_see_ho.html
http://marginalrevolution.com/marginalrevolution/2005/07/markets_in_ever_6-2.html
http://marginalrevolution.com/marginalrevolution/2005/12/seasonal_advice.html
http://marginalrevolution.com/marginalrevolution/2005/12/seasonal_advice_2.html
http://marginalrevolution.com/marginalrevolution/2005/07/john_kay_on_cli.html
http://marginalrevolution.com/marginalrevolution/2005/12/seasonal_advice_1.html
http://marginalrevolution.com/marginalrevolution/2005/07/choosing_whethe.html
http://marginalrevolution.com/marginalrevolution/2005/07/what_is_the_rig-2.html
http://marginalrevolution.com/marginalrevolution/2005/07/a_critic_on_cri.html
http://marginalrevolution.com/marginalrevolution/2005/07/red_tape_and_ho.html
http://marginalrevolution.com/marginalrevolution/2005/07/should_londoner.html
http://marginalrevolution.com/marginalrevolution/2005/07/risky_business_1.html

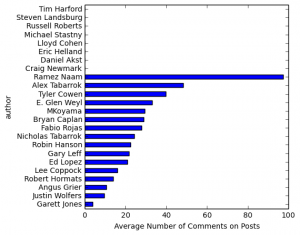
I also looked at the amount of discussion generated by each author:

Note that some of these authors only posted once or twice which would skew their results. Also, some posted in the blog’s early years where there appear to be few comments (e.g. Tim Harford in 2005). Interesting to see that Alex’s posts on average seem to generate slightly more comments. Of course, the total amount of discussion / engagement is way higher for Tyler, given that he posts about 5 times as much as Alex.

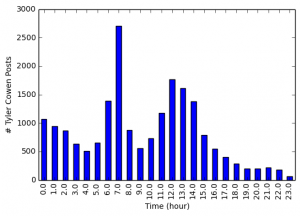
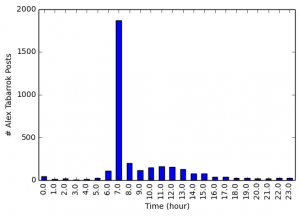
Another easy thing to do is examine the time of post to get an idea of the blogging habits of each of the authors. Each blog post includes the time of publication down to the minute. 

Looking at the time of the post reveals some clear patterns. Tyler Cowen is most likely to post in the morning, around 7 am, although he is also likely to post in the early afternoon. 

Alex Tabarrok clearly has a much more rigid blogging schedule. Almost all of his posts are published around 7 am.

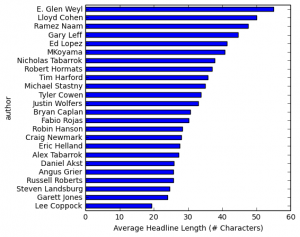
You can also get an idea of the writing techniques and writing habits of the blog authors. I’m barely scratching the surface of what’s possible here, but as a start I simply looked at the number of characters in the headline. The headline is the most important part of a blog post as it determines whether the reader will continue to read.

The longest headline in Marginal Revolution is 117 characters: The Icelandic Stock Exchange fell by 76% in early trading as it re-opened after closing for two days last week.” The table below shows the different average headline length for each of the blog authors. Tyler tends to use longer headlines than Alex.

Interestingly, when I read through the top 10 longest headlines, I noticed one called: “Browse every book hyperlink ever posted on Marginal Revolution (is this the second best website ever?)Clearly I’m not the first person to have scraped Marginal Revolution!

My goal now is to figure out what to do with this data to make the 3rd best website ever…

Addendum: In the comments, the creator of Marginal Revolution Books points to the github repository for his website.

Adventures in Open Data Hacking – Winnipeg Tree Data!

As a data guy, I’m pretty excited to see my city making a strong commitment to open data. The other day, I was sifting through some of this stuff to see what I could play with and what kind of interesting data mash-ups I could create with it. Very soon, my prayers were answered, with the Winnipeg tree inventory – yes, that’s right, the City of Winnipeg keeps a detailed database of all 300,000+ public trees located in the City, including botanical name, common name, tree size (diameter), and precise GPS coordinates!

After chuckling to myself in amusement for a while about how awesome this is, I dug into the data. Read on to see the results. 

You can find the code I used to create the visualizations here. For those curious, I used Python, along with a couple of amazing geographic mapping packages: GeoPandas (incorporates geographic data types into the Pandas package) and Folium (allows you to write Leaflet.js maps using Python code).

Most common trees

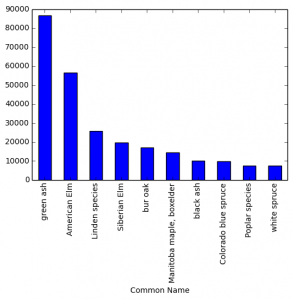
Turns out that, by far, the most common trees in the city are Green Ash and American Elm. These two types represent almost half of the trees in the database. Check out the plot below to see the top 10 tree types in the City.

Rarest trees

As shown in the previous plot, there are a few types of trees that totally dominate. Looking at the other end of the spectrum, there are quite a few tree types that are extremely rare, with only one or two of them found across the entire city. The map below shows the location of the 50 rarest trees (click on the tree to see the tree type). A valuable resource for all you rare tree hunters.

Biggest trees

The map below shows the 50 biggest trees in Winnipeg (by diameter). The size of each of the green dots represents the size of the tree. As you can see in the map, apparently there is a monster American Elm in Transcona that I may have to check out next time I’m the area.

Neighbourhoods with the most trees

Next, I thought I would mash-up the tree data with neighbourhood boundary data also available from the City of Winnipeg website to see what the tree situation is like for each neighbourhood.

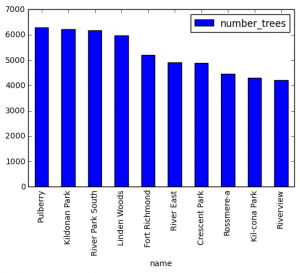
Looking at the total number of trees, Pulberry is in the lead, followed by Kildonan Park, River Park South, and Linden Woods.

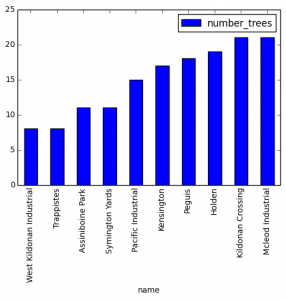
Here are the 10 neighbourhoods with the fewest trees.

I also put together a choropleth map to visualize at a glance the total number of trees in each neighbourhood.

These measurements aren’t totally fair, since bigger neighbourhoods will naturally have more trees. A better measure of how tree-filled a neighbourhood is the tree density, or the number of trees per square kilometres. The map below shows the tree density of all the neighbourhoods in the city.

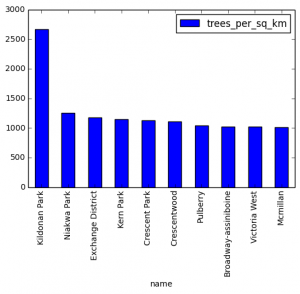
Looking at the top ten neighbourhoods in terms of tree density, many are (not surprisingly) parks (Kildonan Park is the most densely treed, by far).

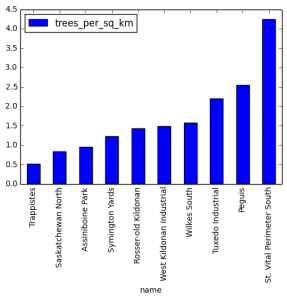
The plot below shows the 10 neighbourhoods with the lowest tree densities. Interestingly, Assiniboine Park is near the bottom. The only explanation I can think of is that the trees there are privately owned (the data only includes public trees).

Other ideas?

There are a lot of other ways you could slice, dice, and mash-up the data with other sources to get more interesting results. Here’s a few things I thought of:

  • Zooming in on one neighbourhood and show a dot map or heat map of all the trees to show the distribution.
  • Looking at  percentage of the trees that come from parks and filtering out park trees.
  • Developing a “tree index” for each neighbourhood (like something you would see on a real estate ad to describe the neighbourhood).
  • Examining the most common types of trees in each neighbourhood.

Comment below if you have any suggestions / requests!