As a data guy, I’m pretty excited to see my city making a strong commitment to open data. The other day, I was sifting through some of this stuff to see what I could play with and what kind of interesting data mash-ups I could create with it. Very soon, my prayers were answered, with the Winnipeg tree inventory – yes, that’s right, the City of Winnipeg keeps a detailed database of all 300,000+ public trees located in the City, including botanical name, common name, tree size (diameter), and precise GPS coordinates!
After chuckling to myself in amusement for a while about how awesome this is, I dug into the data. Read on to see the results.
You can find the code I used to create the visualizations here. For those curious, I used Python, along with a couple of amazing geographic mapping packages: GeoPandas (incorporates geographic data types into the Pandas package) and Folium (allows you to write Leaflet.js maps using Python code).
Most common trees
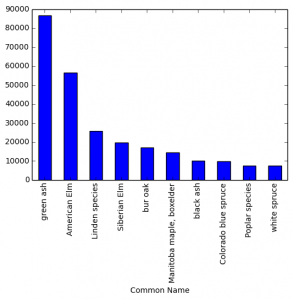
Turns out that, by far, the most common trees in the city are Green Ash and American Elm. These two types represent almost half of the trees in the database. Check out the plot below to see the top 10 tree types in the City.
Rarest trees
As shown in the previous plot, there are a few types of trees that totally dominate. Looking at the other end of the spectrum, there are quite a few tree types that are extremely rare, with only one or two of them found across the entire city. The map below shows the location of the 50 rarest trees (click on the tree to see the tree type). A valuable resource for all you rare tree hunters.
Biggest trees
The map below shows the 50 biggest trees in Winnipeg (by diameter). The size of each of the green dots represents the size of the tree. As you can see in the map, apparently there is a monster American Elm in Transcona that I may have to check out next time I’m the area.
Neighbourhoods with the most trees
Next, I thought I would mash-up the tree data with neighbourhood boundary data also available from the City of Winnipeg website to see what the tree situation is like for each neighbourhood.
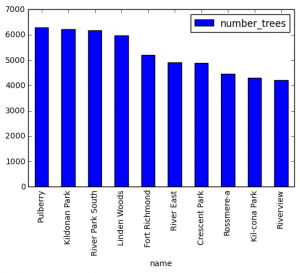
Looking at the total number of trees, Pulberry is in the lead, followed by Kildonan Park, River Park South, and Linden Woods.
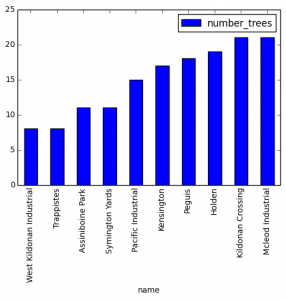
Here are the 10 neighbourhoods with the fewest trees.
I also put together a choropleth map to visualize at a glance the total number of trees in each neighbourhood.
These measurements aren’t totally fair, since bigger neighbourhoods will naturally have more trees. A better measure of how tree-filled a neighbourhood is the tree density, or the number of trees per square kilometres. The map below shows the tree density of all the neighbourhoods in the city.
Looking at the top ten neighbourhoods in terms of tree density, many are (not surprisingly) parks (Kildonan Park is the most densely treed, by far).
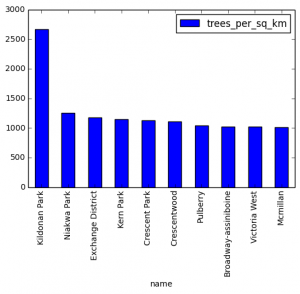
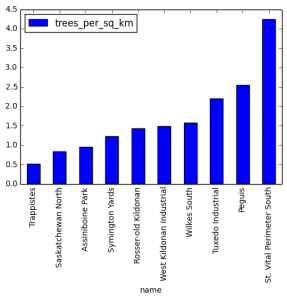
The plot below shows the 10 neighbourhoods with the lowest tree densities. Interestingly, Assiniboine Park is near the bottom. The only explanation I can think of is that the trees there are privately owned (the data only includes public trees).
Other ideas?
There are a lot of other ways you could slice, dice, and mash-up the data with other sources to get more interesting results. Here’s a few things I thought of:
- Zooming in on one neighbourhood and show a dot map or heat map of all the trees to show the distribution.
- Looking at percentage of the trees that come from parks and filtering out park trees.
- Developing a “tree index” for each neighbourhood (like something you would see on a real estate ad to describe the neighbourhood).
- Examining the most common types of trees in each neighbourhood.
Comment below if you have any suggestions / requests!
For access to my shared Anki deck and Roam Research notes knowledge base as well as regular updates on tips and ideas about spaced repetition and improving your learning productivity, join "Download Mark's Brain".
Publicly owned golf courses vs. private owned golf courses might skew the data a bit
Yeah good point!